

When setting the budget, one thing you are never going to get perfect is for the actual revenue and expenses to precisely hit the budget that you set. There will always be items that are under budget and others that are over budget.
Inherent in the budgeting process is that there are a myriad of assumptions that you make: utility bills will be the same as last year plus inflation; we have a new service/product which we hope will bring in a certain amount of revenue; we need to invest in some IT work to improve systems which will cost a certain amount.
The budget is a series of guesses – well, educated guesses! You have targets and predictions and know what happened last year, so you can usually make a fairly good ‘guess’, but there will always be overs and unders – as compared with the assumptions.
Put another way, your budget makes assumptions about the baseline projections which are subject to both risks (negative impacts) and opportunities (positive impacts). So, when the CEO/CFO write the budget or the Board reviews it, how can you quantify whether it is a conservative or stretch budget, and how do you know what risks there are to achieving it?
ISO31000 defines risk as the “effect of uncertainty on objectives” and uncertainty is “is a positive or negative deviation from what is expected”. So, applying this to the budget, there are risks of negative deviations to the budget, and opportunities for positive deviations to the budget.
There’s a risk that the insurance bill increased significantly more than inflation this year, meaning that it costs more than you budgeted. There’s also an opportunity that the new service/product you have started goes better than planned, or a fundraising event raises more than you expect.
While it is true that many of these overs and unders can even each other out, most organisations most years will find a few major deviations which are the key reasons why the result varies significantly to budget.
There are known risks/opportunities as well as unknown ones. We understand that organisations would not have expected a COVID-19 style disruption to their budget earlier this year! This was an unknown and unpredictable risk which organisations have had to deal with. (Organisations setting 2020/21 budgets now have likely factored in COVID-19 tax benefits and Job Keeper payments.)
However, where there are known or anticipated risks/opportunities, how can you consider these kinds of possible deviations when setting the budget?
I’ve worked in exec and board roles for a number of different organisations but the best model I have seen for this is to identify in the order of four to six key risks, and a similar number of opportunities, in a table presented as part of the budget document. It’s not about identifying every possible small deviation, but thinking about what are the biggest risks to achieving the budget, and where are the areas that will be most impactful if you can maximise the opportunity.
I want to pause a moment and reflect that this blog article is written for the not for profit sector who are focused on social objectives and not purely profit-making metrics. There is an interplay between finances and achieving the organisation’s social purpose. The point of this article is not to suggest ‘taking opportunities’ by cutting costs or services that deliver on the social purpose. But it is about being fiscally responsible in managing the finances to minimise the negative risks and maximise the opportunities since financial sustainability is important to every organisation in the long run. It’s also about exploiting opportunities around new service development, contracts, fundraising, grants etc – all positive ways to increase both revenue and social impact.
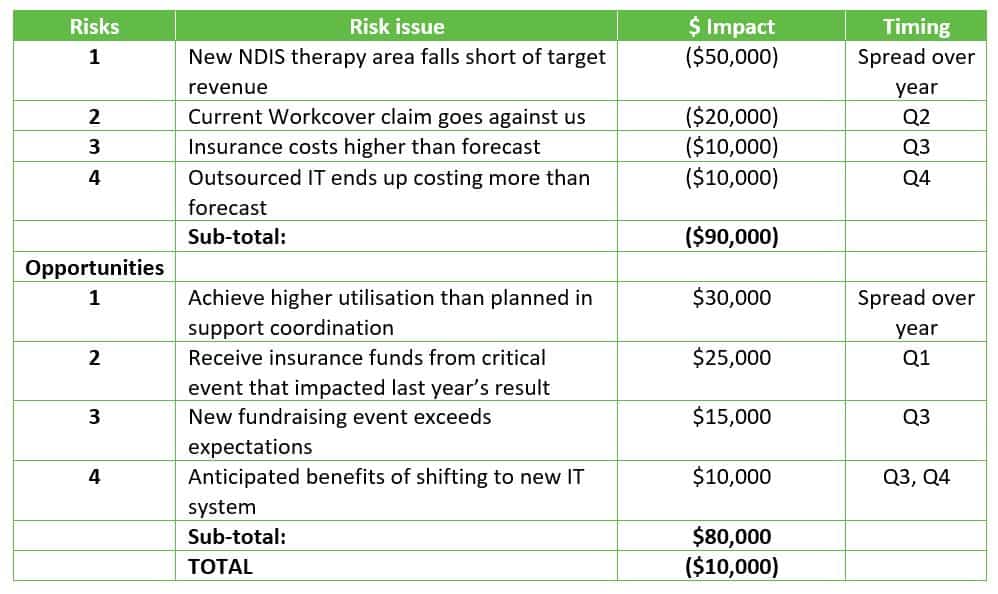
The table of risks and opportunities should include:
- A brief summary of the risk/opportunity
- An estimated dollar value of the impact
- Sub-totals for risks (negatives) and opportunities (positives)
- Total of the net risk/opportunity
For a more sophisticated approach, you might consider identifying an approximate timing for when the risk/opportunity is expected to materialise. It might be too precise to list a month, but identifying a quarter in the year can be helpful.
Once the table is complete, you can add up the dollar amounts and it provides an understanding of whether there is more risk than opportunity, or vice versa, and also an indication of how optimistic or conservative the base budget might be. A hurricane graph could be used to plot the ups/downs.
The best part about a model like this is that it is easily adopted by any organisation. The key point is around materiality – a $10k opportunity is not worth mentioning for a $100m organisation. Whilst I first observed this model operating in a $400m commercial business, I also applied the exact same process when I was on the board of a small business turning over under $1m.
Here’s a simple example for a mid-size disability service organisation. It can be seen how the opportunities almost counteract the risks, but it will need proactive management to achieve that result.
After using this in the budget process, you can also utilise it as an ongoing management reporting tool. Having an updated table of risks and opportunities in the regular management/Board report provides a focus and accountability. It can drive questions like: What has been done this month to ensure we capitalise on the opportunities? What more needs to be done now to minimise the risks?
Identifying risks and opportunities in the budget is a good step to improving your organisation’s risk maturity. It can also then be used to drive a recognition of financial risk/opportunity in the management reports throughout the year.


