

Data visualisation will change your life and there’s a very good chance that it already has. Start-ups will talk about “hockey stick growth” and you’ve no doubt heard the term “flattening the curve”. Both terms refer to data visualisation and quite simply the insights that are drawn from being able to see past a mass of numbers, as data is presented in graphs and infographics. This cuts through the noise often created by large sets of data and allows people to see trends and outliers which in turn brings a focus to the key indicators that drive change.
Before we move to the impact that data visualisation can have, it’s worth defining data visualisation.
Data visualisation is the graphical representation of information and data ¹
This sounds simple enough but in a world of endless facts, figures and information, data visualisation provides a number of benefits.
Here are three key benefits of data visualisation:
1. Appeals to visual people
Everybody has their own unique learning style and medium for which they prefer to take in information. A large proportion of the population prefer visual images, particularly over large sets of numbers. Data visualisation – for all the obvious reasons – appeals to this portion of the population.
2. A picture tells a thousand words
Well visualised data can portray vast amounts of information in just one graphic, making it much more efficient for time poor readers (such as Boards) to access and interpret information.
3. Quicker insights
Insights can be gained much much quicker, particularly in comparison to a list of numbers. Trends, disproportionate data sets and outliers are all significantly easier to identify when visualised., The impact of graphs and infographics is immediate, and – when done well – easy to understand and interpret. This can allow for greater transparency amongst various stakeholders which can in turn lead to quicker and more accurate decision making.
Data visualisation operates at different levels. In its simplest form, it highlights anomalies (such as year on year differences or the difference between budgets and actuals). At this level, it may not explain the drivers or reasons behind the trends identified, rather it highlights areas for further investigation and analysis. For more sophisticated reporting, data visualisation may represent more complex information – perhaps in relation to your KPIs or other indicators – that helps to explain the context beneath the headline results.
This may sound great in theory and something that only applies to particular organisations – or big data – but it very much applies to the not for profit sector. We are currently working with a number of not for profits to present their financial data in more visual formats.
The visualisation and presentation of financial data and information can highlight and present the following:
Trends
- Revenue trends
- Expense trends
- Cash flow trends
- Monthly trends
- Annual trends
Proportions
- Major revenue items
- Major expense items
- Major balance sheet items
Comparisons
- Actuals vs budget
- This year vs last year
Targets
- Year to date actuals vs annual target
Of course knowing what data to visualise and how best to visualise it is a skill in itself. With the right data visualised in the most appropriate and meaningful way, organisations’ boards and leadership are supported in interpreting data so that they can make well informed decisions and take appropriate actions.
Example
The following is a simple example of data visualisation:
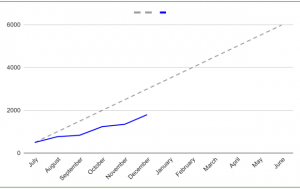
- Not for profit XYZ set an annual target to spend $6,000 this financial year on a particular social objective.
- As shown in the chart below, after six months into the year, the organisation is well behind its target. and will need to take more action and spend more money in the remaining six months if they are to meet their annual objective.
- The chart below very clearly and concisely presents this information, evidenced by the linear target which is in line with a linear objective (in this instance). This allows those reviewing the chart (ie the CEO and board) to quickly identify this as an area for further discussion and investigation and discuss required next steps.
In summary when the right data is visualised in the most appropriate way, it can either provide focus on areas for further discussion – or provide meaningful insights in its own right. This in turn can inform decisions and actions that support an organisation towards achieving their objectives.


